SURICATA Dashboards
[SURICATA] Alerts
Description
Indexes: cvah-suricata.alert*
Datasets: suricata.alert
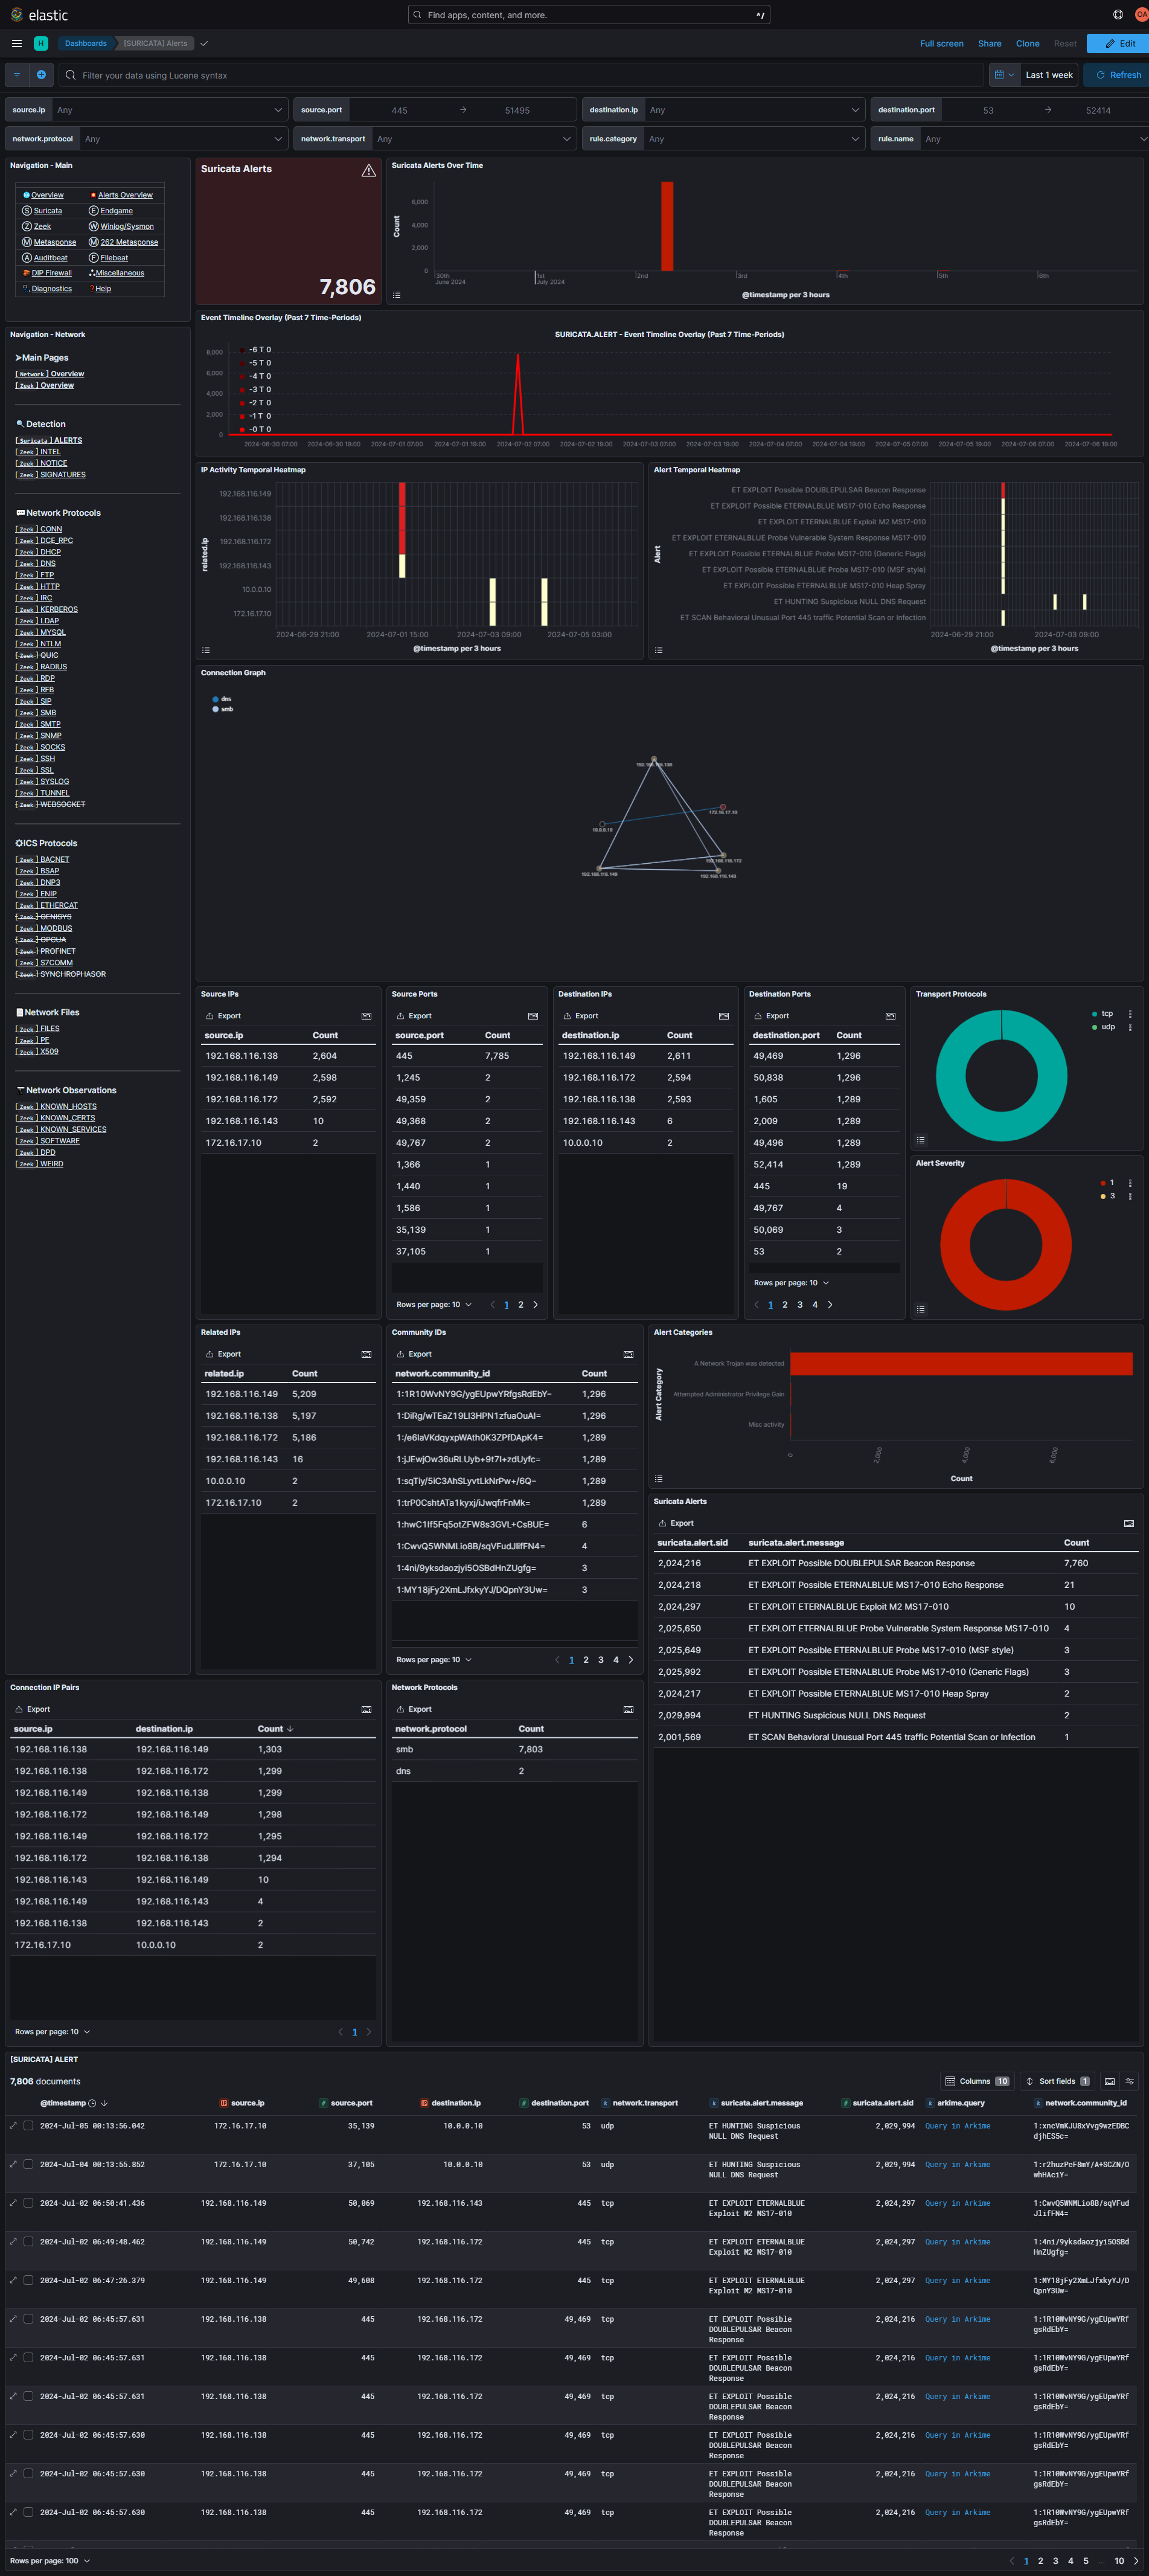
Accessed by clicking on the Suricata link in the main dashboard navigator, this dashboard is where all Suricata alerts are stored. Since all Suricata alerts are turned into Elastic Detection Alerts, it is recommended that the alerts are handled within the Elastic Security app since whitelisted/closed alerts are not reflected in this dashboard (this dashboard displays ALL Suricata alerts).
- Viewing the quantity of raw Suricata alerts - regardless of their whitelisting/closure status within the Elastic Security app
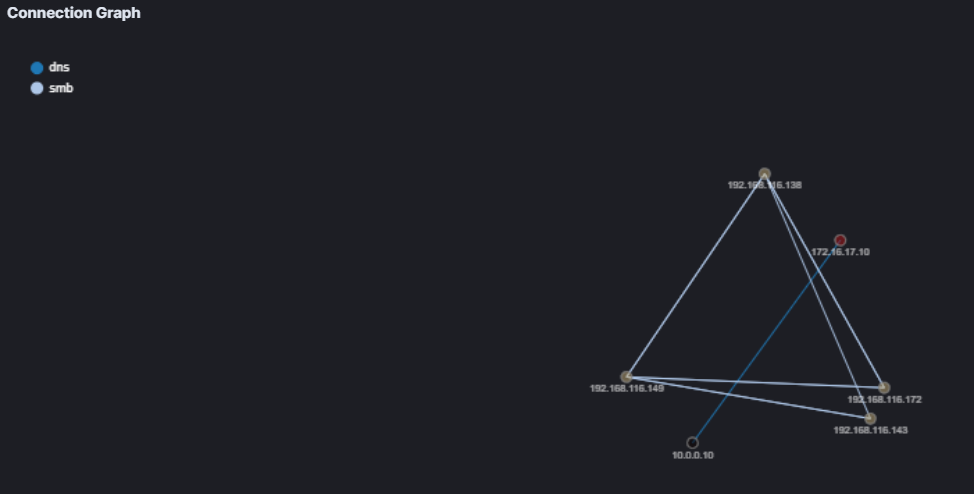
- Viewing a node connection graph related to Suricata alerts
- Filtering/pivoting on data points between Suricara alerts
Notable Visualizations
-
Heatmaps: Temporal heatmaps highlighting alert activity relating to specific IPs - can be used to determine which IPs generate the most alerts and when.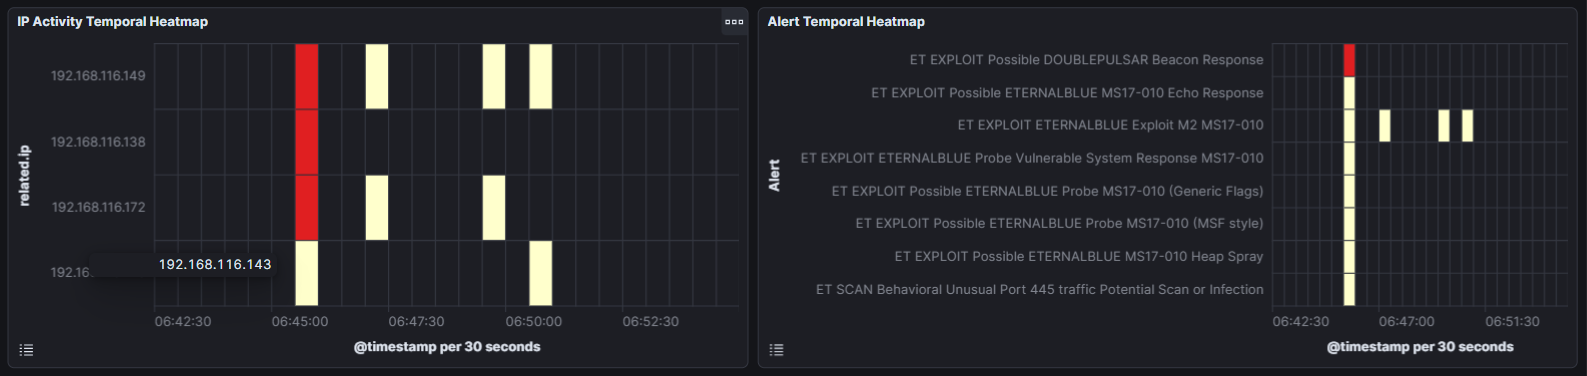
-
Connection Graph: A non-interactive (limited to only highlighting nodes) Vega-lite graph that visualizes the connections between IP addresses that generate Suricata alerts.